Operating Environment
This review covers the global economic and business operating environment and the performance of the Sri Lankan economy in the wake of such global and other country specific developments. It also looks at how all these events impacted the Sri Lankan financial sector. The performance of the Bank in 2017 and its future potential need to be assessed in the context of this review.
Overview of global economic environment
Global growth in 2017 is estimated to be at 3.7%, continuing the upswing in global economic activity experienced towards the end of 2016. Investment conditions further improved and global trade rebounded during the year. The IMF anticipates that growth in Europe, Japan, the US, and expected growth pickup in emerging market and developing countries will have accounted for the improvement over 2016.
In particular, the IMF forecasts the growth rate in emerging market and developing countries to have reached 4.7% in 2017. The better prospects and moderate growth momentum in advanced economies and China is expected to have positive spillover effects on emerging economies.
GDP growth
Table – 08
|
2016
% |
2017 (Estimated)
% |
2018 (Projected)
% |
| World output |
3.2 |
3.7 |
3.9 |
| Advanced economies |
1.7 |
2.3 |
2.3 |
| United States |
1.5 |
2.3 |
2.7 |
| Euro Area |
1.8 |
2.4 |
2.2 |
| Japan |
0.9 |
1.8 |
1.2 |
| United Kingdom |
1.9 |
1.7 |
1.5 |
| Emerging markets and developing economies |
4.4 |
4.7 |
4.9 |
| Russia |
-0.2 |
1.8 |
1.7 |
| China |
6.7 |
6.8 |
6.6 |
| India |
7.1 |
6.7 |
7.4 |
| ASEAN 5 |
4.9 |
5.3 |
5.3 |
Source: IMF World Economic Outlook update January 2018
Given below is a synopsis of the economic performance of several developed and emerging market and developing countries and market trends for oil and a few other commodities that shaped the global economic development to a greater extent. Given the substantial trading relationships with these countries, these developments have had a significant impact on the
Sri Lankan economy too.
United States
US tax reforms and associated fiscal stimulus are expected to temporarily raise US growth, with favourable demand spillovers for US. The growth forecast for the United States has been revised upto 2.3% in 2017 given stronger than expected activity in 2017, higher projected external demand, and expected macroeconomic impact of the tax reform, in particular the reduction in corporate tax rates and the temporary allowance for full expensing of investment. The United States accounts for 11.3% of
Sri Lanka’s value of imports and exports.
Euro Area
With a projected growth of 2.4% for 2017, its fastest pace in a decade, the Euro zone benefited from increased exports that went hand in hand with the strengthened global trade activity. Stability in the financial and political climate also helped to drive domestic demand growth. Euro Area accounts for 17.0% of Sri Lanka’s value of imports and exports.
Japan
Japan is estimated to have achieved 1.8% growth in 2017. Conducive external environment and the resulting increase in exports and the temporary fiscal support package contributed to this growth. Demographic factors such as ageing population and shrinking workforce, low wage growth and low inflation are weighing heavily on the future growth, while growth in public investments in preparations for 2020 Olympic Games is expected to boost the economy. Japan accounts for 4.0% of Sri Lanka’s value of imports and exports.
United Kingdom
Growth in the United Kingdom, Sri Lanka’s second largest export destination, is projected to have slowed down to 1.7% by end 2017, with further slowdown anticipated in the future. This is primarily due to uncertainty arising from Brexit and inflationary pressures affecting real income and private consumption. Firms will also likely hold off on significant investment decisions until they understand better the future of the UK’s trading relationship with the European Union. The United Kingdom accounts for 4.6% of Sri Lanka’s value of imports and exports.
Russia
Recovery in trade, rising oil prices and macroeconomic stability helped Russian economy to return to an estimated modest growth of 1.8% during the year from -0.2% last year. Growth momentum is expected to continue aided by fiscal consolidation, new fiscal rule and significant advances in agricultural sector.
China
China’s growth in 2017 is projected to have reached 6.8%. Increased household incomes and domestic demand, a recovery in global trade, policy easing and supply-side reforms contributed to its strong performance. Given that it is the second largest economy in the world, its currency, Renminbi is now one of the most traded currencies in the world and is fast on its way to internationalisation. China accounts for 15.0% of Sri Lanka’s value of imports and exports.
India
A slowdown in India’s growth momentum saw their estimated growth at 6.7% at the end of 2017. The effects of the November 2016 currency exchange initiative still lingered in 2017. The introduction of a country-wide Goods and Services Tax in the middle of the year added further uncertainty. The Indo-Sri Lanka Economic and Technology Cooperation Framework Agreement (ETCA) that is currently being negotiated between India and Sri Lanka will potentially lead to increased investment opportunities for both countries. Furthermore, it would place Sri Lanka as the only country to have preferential access to China, India and Europe. India accounts for 14.7% of Sri Lanka’s value of imports and exports.
Oil
An improving global growth outlook, the extension of the OPEC+ agreement to limit oil production, and geopolitical tensions in the Middle East have attributed in increasing crude oil prices by about 20% between August 2017 and mid December 2017, to over USD 60 per barrel.
Sri Lankan Economy
The Sri Lankan economy grew at a moderate 3.7% in the first nine months of the year, compared to 4.0% in the same period during 2016. Growth continued to be affected by adverse weather taking a toll on the agriculture sector, which indirectly impacted other sectors such as agro-based industries as well. The Industry and Services sectors, however, had a positive impact on the growth of the economy. The Services sector in particular was propped up by strong performances in financial services, wholesale and retail trade, and transportation. Nevertheless, economic growth in 2017 is expected to be lower than the growth projected at the beginning of the year. Growth in 2018 is now projected between 5.0% – 5.5%.
The increase in investment and consumption expenditure in the first half of the year also played a role in the growth of GDP. Sri Lanka announced plans to change its Foreign Direct Investment (FDI) policy to focus more on its competitive advantages in location, skills base, and its ongoing efforts to secure free trade agreements with developed and emerging markets such as Singapore, China and India. Ideally, the country wants to entice foreign investors from the US, China, and India with consistent policies, potentially attracting USD 5.0 – 6.0 Bn. in the next three years.
The gains from export earnings were offset by weather-related imports and a decline in workers’ remittances. The Central Bank stated that the adverse economic and geopolitical situation in the Middle East will continue to have a negative impact on workers’ remittances, a key source of foreign exchange earnings.
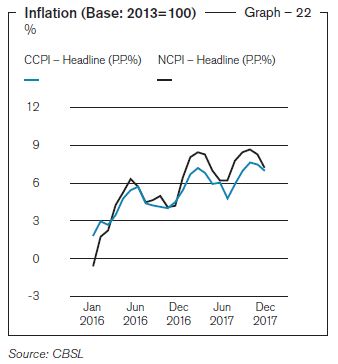
Inflation was marked by an increase to 7.3% (National Consumer Price Index,
2013 = 100) year on year in December 2017. The increase was beyond the CBSL’s target of 4-6%, a result of the combination of high food prices due to adverse weather, upward revisions of indirect taxes, and rising international commodity prices.
Earnings from exports grew 7.6% year on year, thanks to the restoration of GSP+ concessions from the European Union, more effective trade policies, and a competitive exchange rate. However, imports expenditure grew 9.6% year on year, further widening the trade deficit.
The Sri Lankan Rupee depreciated 2.6% against the US Dollar by end December 2017. A market tilted in favour of outflows through import expenditure, debt service payments, and the unwinding of foreign investments in Government Securities initially had a negative impact on the currency. Increased inflows from foreign investments to the Colombo Stock Exchange (CSE) and Government Securities market after the first quarter of 2017 started to ease pressure on the currency. The issuance of the International Sovereign Bond and the receipt of the fourth tranche of the International Monetary Fund Extended Fund Facility (IMF-EFF) in December 2017 helped to further ease-off the currency depreciation. More foreign exchange inflows are expected in the years ahead with the commencement of the Colombo Port City and the Hambantota Industrial Zone.
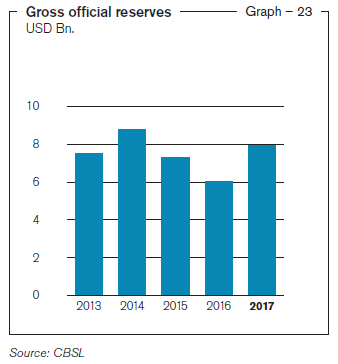
The country’s gross official reserves increased to USD 7.9 Bn. by end 2017, compared to USD 6.0 Bn. at end 2016.
Sri Lankan Banking Sector
During the year 2017, the CBSL took several measures to promote a dynamic and resilient financial sector in the country. These included, among others, the introduction of a transparent market-based auction mechanism for the issuance of Government Securities, the enactment of a new Foreign Exchange Act to enhance overall efficiency of forex transactions, the implementation of Basel III, the strengthening of the framework to regulate Non-Banking Financial Institutions sector, the resolution of distressed finance companies, the strengthening of the regulatory framework for the microfinance sector, and measures to modernise the payment and settlement infrastructure.
Despite the relatively slower economic growth, the expansion of Sri Lanka’s financial sector continued in 2017, accounting for 3.4% of the country’s estimated GDP during the first nine months. The banking sector reported an 19.2% increase year over year in profits after tax in 2017 compared to 2016.
The CBSL maintained a tight monetary policy by raising interest rates. Key policy rates of the Standing Deposit Facility Rate and the Standing Lending Facility Rate were increased by 25 basis points each to 7.25% and 8.75% respectively with effect from March 2017. This may have helped to reduce the inflationary impact of the increased supply of money and high financing requirement of the Government budget.
The increased net interest income, revaluation gains, and lower operating expenses created optimal conditions for increased profitability for the Banking sector. The sector recorded a 13.8% increase in its asset base during the year.

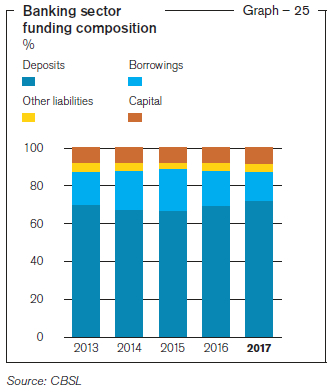
Funding was primarily sourced from deposits, which accounted for 72% of the total assets of the sector. Asset quality improved while capital and liquidity levels were maintained well above regulatory minimum requirements, ensuring stability during the year.
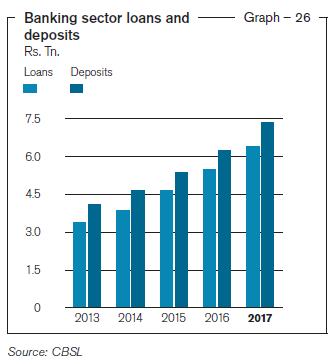
Loans and advances grew by 16% during the year to Rs. 6.3 Tn. Despite the higher interest rates, lending to all economic sectors increased. However, due to macro-prudential policy measures implemented by the CBSL, the leasing portfolio only increased marginally by 3.1%.
Key banking industry indicators
Table – 09
| Industry |
2017
(%) |
CAGR*
2013-17
(%) |
| Business volumes |
|
|
| Assets (YoY) |
13.8 |
15.1 |
| Gross loans and advances (YoY) |
16.1 |
15.3 |
| Asset funding |
|
|
| Deposits (YoY) |
17.5 |
15.3 |
| Borrowings (YoY) |
-5.3 |
14.8 |
| Profitability |
|
|
| Net Interest Income (YoY) |
12.2 |
11.6 |
| Return on equity |
17.6 |
|
| Net interest margin |
3.5 |
|
| Net NPL ratio |
1.3 |
|
| Capital adequacy |
|
|
| Total capital ratio (Minimum 10%) |
15.2 |
|
| Liquidity |
|
|
| Liquid asset ratio (Minimum 20%) |
28.5 |
|
*Compounded Annual Growth Rate
Source: CBSL